JUNO
This page shows some graphs related to Juno orbit insertion around Jupiter on July 2016.
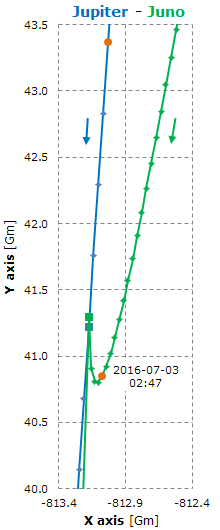
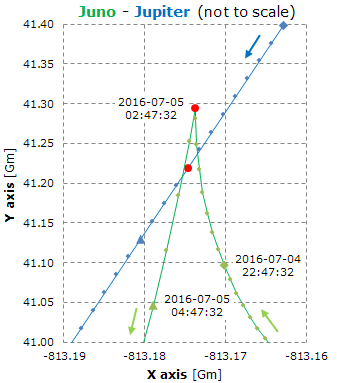
These two graphs show the geometry of the initial approach (left graph) and of the orbit insertion (right graph).
Same symbol for the same instant; for example, the two orange circles represent the Jupiter and the Juno position at the UTC time shown in the graph.
The Sun position is x = 0, y = 0.
The points are plotted with a constant time step of 12 hours for the left graph and 30 minutes for the right graph.
The two squares represent the two bodies when Juno was at the periapsis (2016-07-05 02:47:32 UTC), which is also shown in the detailed view by the two red circles.
Here's the 3D version of the left graph.
In this graph, the points are plotted with a constant time step of 4 hours.
Hover the mouse over a point to see the date, the speed wrt Sun (km/s) and the distance (km) between the two objects.
This detailed view shows the Juno polar orbit insertion in the Jupiter inertial reference frame.
If you hover the mouse over a blue point (the path of Juno), a label appears showing the date (UTC), the speed (km/s) of Juno wrt Jupiter and the altitude (km) above Jupiter surface (the planet is modeled as an ellipsoid with an equatorial radius of 71492 km and a polar radius of 66854 km).
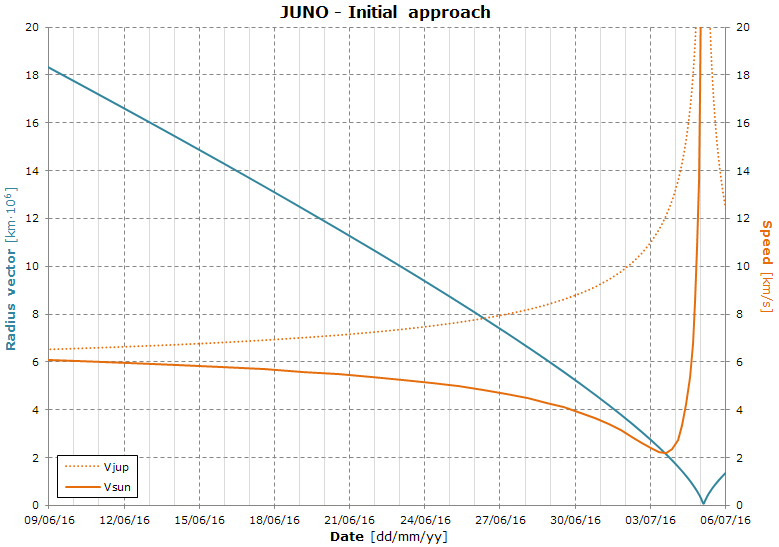
It is interesting to note how the approach geometry initially decelerates Juno wrt the Sun from 6.5 km/s to less than 2.2 km/s and then it accelerates Juno up to 59.3 km/s at the periapsis, as shown in the next graph.
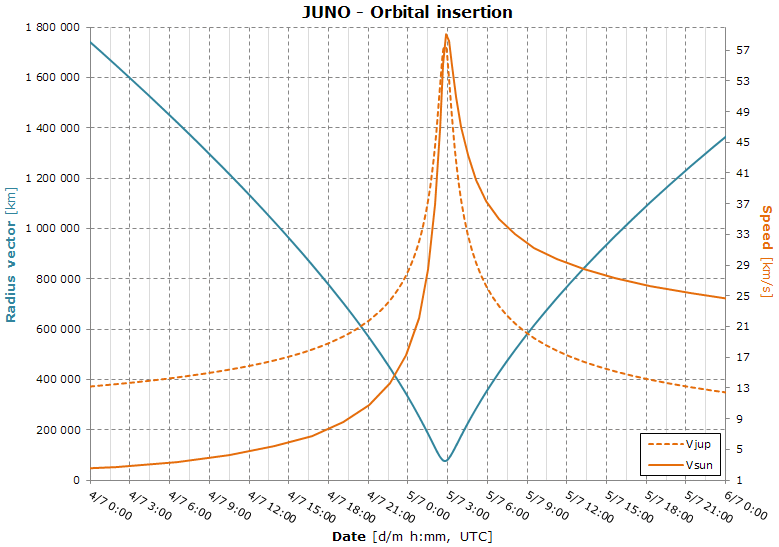
In this detailed view, we see the big speed increasing of Juno as it approaches the periapsis.
The radius vector at periapsis was about 76000 km and its altitude was about 4500 km. The maximum speed wrt Jupiter was 57.9 km/s.