Kwangmyongsong 4 reentry prediction
The air density (the most significant unknown in determining the reentry date) is calculated by means of NRLMSISE-00 atmosphere model along with two data files for the current and predicted solar and geomagnetic indices. Please, see here for the current value and short range prediction of the solar and geomagnetic indices and here for the long range prediction.
Starting from 2022-10-15, the predictions actually include three different simulations with the purpose of defining a confidence interval for the reentry date.
The indices contained in the Archived Forecast files are compared with the measured values ("BEGIN OBSERVED"/"END OBSERVED" block of the "Legacy starting 1957 Oct 01" file in the "Space Weather Data" section). Then two confidence intervals are calculated for each day; one for F107measured / F107predicted and the other for Appredicted - Apmeasured. Since those errors are very far from being normally distributed, a distribution-free confidence interval formula needs to be used.
The paper "Non-parametric detection of meaningless distances in high dimensional data" by Ata Kabán gives the formula 17, which is used in the simulations to calculate the confidence interval for the errors for each day beyond the last available measured values. All those confidence intervals are used to calculate, day by day, the lower and upper bounds of the F107 and Ap indices.
The graphs show three sets of plots: blue trajectories are obtained using the upper bound of the confidence interval (higher air density and earlier reentry), the azure trajectories are obtained using the lower bound and the orange trajectories are obtained using the average errors, which are usually slightly less than 1 for the F107 index (on average the NASA's long range forecast is very good).
It should be considered that the two extreme limits are reached only if NASA's long range forecast is always biased to the lower or upper limit throughout the propagation, which is extremely unlikely. To avoid this unlikely scenario, the lower confidence bound (only the lower bound) used for propagation is modulated between the mean and the calculated lower bound. Empirical validation of this method was done by extensive simulations on reentered objects and the result was satisfactory.
For the official reentry time, the 18th Space Defense Squadron gives just this:
NORAD CAT ID SATNAME INTLDES COUNTRY MSG_EPOCH DECAY_EPOCH RCS SOURCE ELSET TYPE
41332 KMS 4 2016-009A NKOR 2023-07-03 17:28:00 2023-06-30 0:00:00 MEDIUM decay_msg TLE | OMM Historical
41332 KMS 4 2016-009A NKOR 2023-06-30 0:00:00 MEDIUM satcat TLE | OMM Historical
Simulation date: 2023-07-04
The initial state of the satellite has been calculated using the following TLEs: (in contrast to the previous simulation, this one does not ignore any TLE).
Reentry date: TT (03:55:51 UTC) ± 60.7 minutes @83.3% confidence level.
Since this simulation was made after the satellite reentry, the atmosphere parameters are observed (not estimated), so there is only one simulation and not three as in previous predictions (in which the parameters were estimated).
Best fit average ballistic coefficient: 47 kg/m2
NRLMSISE-00 data file: "SW-All.txt" updated 2023 Jul 04 03:41 UTC
High precision ITRF93 frame: created 2023-07-03T17:07:02 by NAIF/JPL
Gravity model: SGG-UGM-2 truncated to degree and order 15
The graph shows the predicted instantaneous radius vector scaled to a reference sphere with radius of 6371 km (just to show an approximate altitude). The popup label shows the terrestrial time, the radius vector (km) and the inertial speed (m/s).
The following map shows the probable reentry location (the point where the satellite altitude is about 80 km) calculated with a Monte Carlo simulation (the blue dots represent the original, unmodified, TLEs). Only the last three TLEs were used.
If you hover the mouse over a point, a label appears showing the reentry date (TT), the TLE epoch and the reentry coordinates.
We can see that the most likely reentry point starts about over Japan, passes over Australia, Brazil and continues with the next orbit shifted about 22 degrees west or left (this satellite is retrograde).
Simulation date: 2023-06-30
The initial state of the satellite has been calculated using the following TLEs: .
The most recent TLE currently available (23180.76298308) is unreliable and has been ignored.
Reentry date (averaged the TLEs of each set) @ % nominal confidence level (the actual confidence level is 1% to 2% higher):
upper bound of the solar indices
most probable solar indices
modulated lower bound of the solar indices
Best fit average ballistic coefficient: 47 kg/m2
NRLMSISE-00 data files: "SW-All.txt" updated 2023 Jun 30 03:41 UTC, "jun2023f10_prd" updated 2 June 2023
High precision ITRF93 frame: created 2023-06-29T17:07:02 by NAIF/JPL
Gravity model: SGG-UGM-2 truncated to degree and order 15
The graph shows the predicted instantaneous radius vector scaled to a reference sphere with radius of 6371 km (just to show an approximate altitude). The popup label shows the terrestrial time, the radius vector (km) and the inertial speed (m/s).
Simulation date: 2023-06-29
The initial state of the satellite has been calculated using the following TLEs: .
Reentry date (averaged the TLEs of each set) @ % nominal confidence level (the actual confidence level is 1% to 2% higher):
upper bound of the solar indices
most probable solar indices
modulated lower bound of the solar indices
Best fit average ballistic coefficient: 47 kg/m2
NRLMSISE-00 data files: "SW-All.txt" updated 2023 Jun 29 12:40 UTC, "jun2023f10_prd" updated 2 June 2023
High precision ITRF93 frame: created 2023-06-28T17:07:02 by NAIF/JPL
Gravity model: SGG-UGM-2 truncated to degree and order 15
The graph shows the predicted minimum, mean and maximum radius vector scaled to a reference sphere with radius of 6371 km (just to show an approximate altitude), but when the instantaneous radius vector drops below 125 km, the plots no longer show the mean radius vector (or semi-major axis), they show the instantaneous radius vector. The popup label shows the terrestrial time, the radius vector (km) and the inertial speed (m/s).
Simulation date: 2023-06-23
The initial state of the satellite has been calculated using the following TLEs: .
Reentry date (averaged the TLEs of each set) @ % nominal confidence level (the actual confidence level is 1% to 2% higher):
upper bound of the solar indices
most probable solar indices
modulated lower bound of the solar indices
Best fit average ballistic coefficient: 51 kg/m2
NRLMSISE-00 data files: "SW-All.txt" updated 2023 Jun 23 12:40 UTC, "jun2023f10_prd" updated 2 June 2023
High precision ITRF93 frame: created 2023-06-22T17:07:03 by NAIF/JPL
Gravity model: SGG-UGM-2 truncated to degree and order 15
The graph shows the predicted minimum, mean and maximum radius vector scaled to a reference sphere with radius of 6371 km (just to show an approximate altitude), but when the instantaneous radius vector drops below 125 km, the plots no longer show the mean radius vector (or semi-major axis), they show the instantaneous radius vector. The popup label shows the terrestrial time, the radius vector (km) and the inertial speed (m/s).
Simulation date: 2023-06-11
The initial state of the satellite has been calculated using the following TLEs: .
Reentry date (averaged the TLEs of each set) @ % nominal confidence level (the actual confidence level is 1% to 2% higher):
upper bound of the solar indices
most probable solar indices
modulated lower bound of the solar indices
Best fit average ballistic coefficient: 54 kg/m2
NRLMSISE-00 data files: "SW-All.txt" updated 2023 Jun 11 12:40 UTC, "jun2023f10_prd" updated 2 June 2023
High precision ITRF93 frame: created 2023-06-10T17:07:02 by NAIF/JPL
Gravity model: SGG-UGM-2 truncated to degree and order 15
The graph shows the predicted minimum, mean and maximum radius vector scaled to a reference sphere with radius of 6371 km (just to show an approximate altitude), but when the instantaneous radius vector drops below 125 km, the plots no longer show the mean radius vector (or semi-major axis), they show the instantaneous radius vector. The popup label shows the terrestrial time, the radius vector (km) and the inertial speed (m/s).
Simulation date: 2023-05-12
The initial state of the satellite has been calculated using the following TLEs: .
Reentry date (averaged the TLEs of each set) @ % nominal confidence level (the actual confidence level is 1% to 2% higher):
upper bound of the solar indices
most probable solar indices
modulated lower bound of the solar indices
Best fit average ballistic coefficient: 50 kg/m2
NRLMSISE-00 data files: "SW-All.txt" updated 2023 May 12 12:40 UTC, "may2023f10_prd" updated 9 May 2023
High precision ITRF93 frame: created 2023-05-11T17:07:02 by NAIF/JPL
Gravity model: SGG-UGM-2 truncated to degree and order 15
The graph shows the predicted minimum, mean and maximum radius vector scaled to a reference sphere with radius of 6371 km (just to show an approximate altitude), but when the instantaneous radius vector drops below 125 km, the plots no longer show the mean radius vector (or semi-major axis), they show the instantaneous radius vector. The popup label shows the terrestrial time, the radius vector (km) and the inertial speed (m/s).
Simulation date: 2023-04-12
The initial state of the satellite has been calculated using the following TLEs: .
Reentry date (averaged the TLEs of each set) @ % nominal confidence level (the actual confidence level is 1% to 2% higher):
upper bound of the solar indices
most probable solar indices
modulated lower bound of the solar indices
Best fit average ballistic coefficient: 45 kg/m2
NRLMSISE-00 data files: "SW-All.txt" updated 2023 Apr 12 12:40 UTC, "apr2023f10_prd" updated 7 April 2023
High precision ITRF93 frame: created 2023-04-11T17:07:02 by NAIF/JPL
Gravity model: SGG-UGM-2 truncated to degree and order 15
The graph shows the predicted minimum, mean and maximum radius vector scaled to a reference sphere with radius of 6371 km (just to show an approximate altitude), but when the instantaneous radius vector drops below 125 km, the plots no longer show the mean radius vector (or semi-major axis), they show the instantaneous radius vector. The popup label shows the terrestrial time, the radius vector (km) and the inertial speed (m/s).
Simulation date: 2023-03-09
The initial state of the satellite has been calculated using the following TLEs: .
Reentry date (averaged the TLEs of each set) @ % nominal confidence level (the actual confidence level is 1% to 2% higher):
upper bound of the solar indices
most probable solar indices
modulated lower bound of the solar indices
Best fit average ballistic coefficient: 56 kg/m2
NRLMSISE-00 data files: "SW-All.txt" updated 2023 Mar 09 06:40 UTC, "mar2023f10_prd" updated 2 March 2023
High precision ITRF93 frame: created 2023-03-08T17:07:02 by NAIF/JPL
Gravity model: SGG-UGM-2 truncated to degree and order 15
The graph shows the predicted minimum, mean and maximum radius vector scaled to a reference sphere with radius of 6371 km (just to show an approximate altitude), but when the instantaneous radius vector drops below 125 km, the plots no longer show the mean radius vector (or semi-major axis), they show the instantaneous radius vector. The popup label shows the terrestrial time, the radius vector (km) and the inertial speed (m/s).
Here's the difference between the measured F10.7 index and the prediction used in the previous simulation (2022-10-15). The F10.7 index is used in the atmosphere model to calculate the air density.
The graph is useful to understand the three-month difference in the reentry date.
The cumulative sum of the errors is very large (in absolute value), this means that the NASA's long range forecast, in this case, was poor.
Simulation date: 2022-10-15
The initial state of the satellite has been calculated using the following TLEs: .
Reentry date (averaged the TLEs of each set) @ % nominal confidence level (the actual confidence level is 1% to 2% higher):
upper bound of the solar indices
most probable solar indices
modulated lower bound of the solar indices
Best fit average ballistic coefficient: 57 kg/m2
NRLMSISE-00 data files: "SW-All.txt" updated 2022 Oct 15 12:40 UTC, "oct2022f10_prd.txt" updated 04 October 2022
High precision ITRF93 frame: created 2022-10-14T17:07:03 by NAIF/JPL
Gravity model: SGG-UGM-2 truncated to degree and order 15
The graph shows the predicted minimum, mean and maximum radius vector scaled to a reference sphere with radius of 6371 km (just to show an approximate altitude), but when the instantaneous radius vector drops below 125 km, the plots no longer show the mean radius vector (or semi-major axis), they show the instantaneous radius vector. The popup label shows the terrestrial time, the radius vector (km) and the inertial speed (m/s).
Simulation date: 2022-04-17
The initial state of the satellite has been calculated using the following TLEs: .
Reentry date: 2023-09-15 (averaged the 10 TLEs)
Best fit average ballistic coefficient: 45 kg/m2
NRLMSISE-00 data files: "SW-All.txt" updated 2022 Apr 17 12:40:00.00 UTC, "apr2022f10_prd.txt" updated 11 April 2022
Gravity model: SGG-UGM-2 truncated to degree and order 15
The graph shows the predicted minimum, mean and maximum radius vector scaled to a reference sphere with radius of 6371 km (just to show an approximate altitude), but when the instantaneous radius vector drops below 125 km, the blue plot no longer shows the mean radius vector (or semi-major axis), it shows the instantaneous radius vector. The popup label shows the terrestrial time, the radius vector (km) and the inertial speed (m/s).
Simulation date: 2020-06-06
The Marshall Solar Cycle Forecast site gives the best estimate value of the F10.7 and Ap indices along with an approximate ±2 sigma interval. This simulation uses the +2 sigma values (95th percentile) to predict the earliest possible reentry date with "high confidence" (a reentry before that date is very unlikely). That lower bound only takes into account the uncertainty of air density and ignore the TLEs uncertainty, but this is perfectly valid, as the TLEs uncertainty is completely negligible compared to the uncertainty of the air density.
The initial state of the satellite has been calculated using the following TLEs: .
NRLMSISE-00 data files: "SW-All.txt" updated 2020 Jun 06 06:45:16 UTC, "may2020f10_prd.txt" updated 11 May 2020
Gravity model: SGG-UGM-1 truncated to degree and order 15
Reentry date: 2024-02-28 (averaged the 10 TLEs)
Earliest reentry: 2022-10-24 (averaged the last 5 TLEs)
Best fit average ballistic coefficient: 81 kg/m2
The graph shows the predicted minimum, mean and maximum radius vector scaled to a reference sphere with radius of 6371 km (just to show an approximate altitude), but when the instantaneous radius vector drops below 125 km, the blue plot no longer shows the mean radius vector (or semi-major axis), it shows the instantaneous radius vector. The popup label shows the terrestrial time, the radius vector (km) and the inertial speed (m/s).
The next graph is obtained for an high solar activity (95th percentile of the indices).
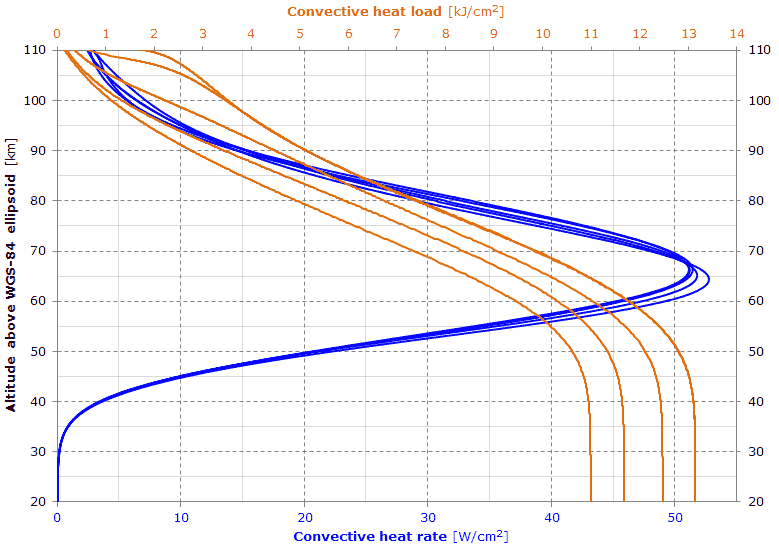
Here's the thermal stress prediction.
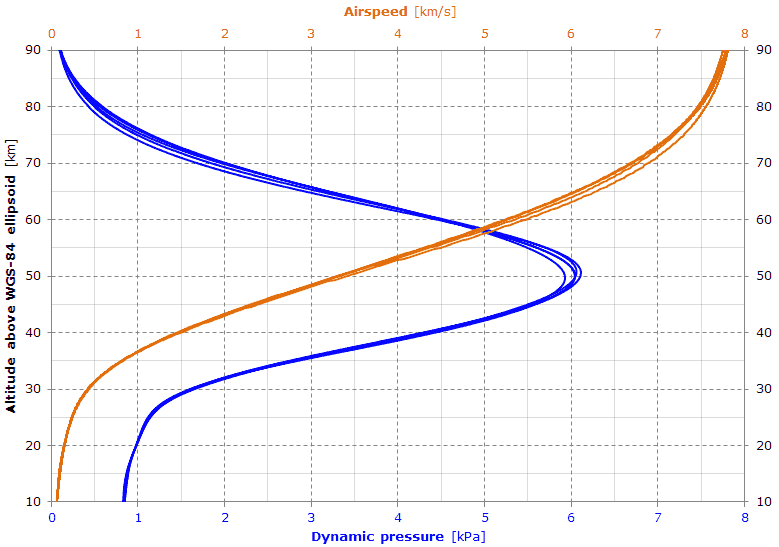
The graph shows the dynamic pressure and the airspeed during reentry.
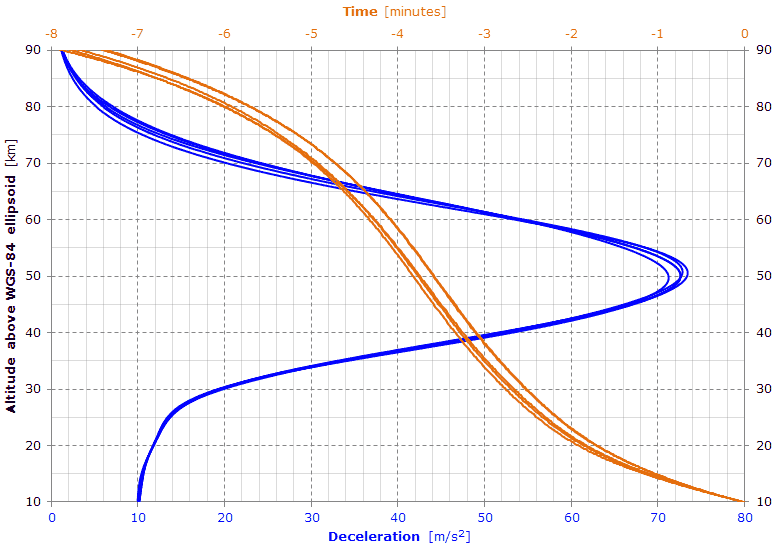
This last graph shows the deceleration and the time taken to go from 90 km down to 10 km.