COSMOS 482 reentry prediction
The air density (the most significant unknown in determining the reentry date) is calculated by means of NRLMSISE-00 atmosphere model along with two data files for the current and predicted solar and geomagnetic indices. Please, see here for the current value and short range prediction of the solar and geomagnetic indices and here for the long range prediction.
Starting from 2022-09-14, the predictions actually include three different simulations with the purpose of defining a confidence interval for the reentry date.
The indices contained in the Archived Forecast files are compared with the measured values ("BEGIN OBSERVED"/"END OBSERVED" block of the "Legacy starting 1957 Oct 01" file in the "Space Weather Data" section). Then two confidence intervals are calculated for each day; one for F107measured / F107predicted and the other for Appredicted - Apmeasured. Since those errors are very far from being normally distributed, a distribution-free confidence interval formula needs to be used.
The paper "Non-parametric detection of meaningless distances in high dimensional data" by Ata Kabán gives the formula 17, which is used in the simulations to calculate the confidence interval for the errors for each day beyond the last available measured values. All those confidence intervals are used to calculate, day by day, the lower and upper bounds of the F107 and Ap indices.
The graphs show three sets of plots: blue trajectories are obtained using the upper bound of the confidence interval (higher air density and earlier reentry), the azure trajectories are obtained using the lower bound and the orange trajectories are obtained using the average errors, which are usually slightly less than 1 for the F107 index (on average the NASA's long range forecast is very good).
It should be considered that the two extreme limits are reached only if NASA's long range forecast is always biased to the lower or upper limit throughout the propagation, which is extremely unlikely. To avoid this unlikely scenario, the lower confidence bound (only the lower bound) used for propagation is modulated between the mean and the calculated lower bound. Empirical validation of this method was done by extensive simulations on reentered objects and the result was satisfactory.
The graph shows the reentry dates and confidence interval calculated with a given simulation.
Simulation date: 2024-04-06
The initial state of the satellite has been calculated using the following TLEs: .
Reentry date (averaged the TLEs of each set) @ % nominal confidence level (the actual confidence level is 1% to 2% higher):
upper bound of the solar indices
most probable solar indices
modulated lower bound of the solar indices
Best fit average ballistic coefficient: 263 kg/m2
NRLMSISE-00 data files: "SW-All.txt" updated 2024 Apr 06 12:40 UTC, "apr2024f10-prd.txt" updated 5 April 2024
High precision ITRF93 frame: created 2024-04-05T17:07:03 by NAIF/JPL
Gravity model: SGG-UGM-2 truncated to degree and order 15
The graph shows the predicted minimum, mean and maximum radius vector scaled to a reference sphere with radius of 6371 km (just to show an approximate altitude), but when the instantaneous radius vector drops below 125 km, the plots no longer show the mean radius vector (or semi-major axis), they show the instantaneous radius vector. The popup label shows the terrestrial time, the radius vector (km) and the inertial speed (m/s).
Simulation date: 2023-11-21
The initial state of the satellite has been calculated using the following TLEs: .
Reentry date (averaged the TLEs of each set) @ % nominal confidence level (the actual confidence level is 1% to 2% higher):
upper bound of the solar indices
most probable solar indices
modulated lower bound of the solar indices
Best fit average ballistic coefficient: 280 kg/m2
NRLMSISE-00 data files: "SW-All.txt" updated 2023 Nov 21 12:40 UTC, "sep2023f10-prd.txt" updated 11 September 2023
High precision ITRF93 frame: created 2023-11-20T17:07:02 by NAIF/JPL
Gravity model: SGG-UGM-2 truncated to degree and order 15
The graph shows the predicted minimum, mean and maximum radius vector scaled to a reference sphere with radius of 6371 km (just to show an approximate altitude), but when the instantaneous radius vector drops below 125 km, the plots no longer show the mean radius vector (or semi-major axis), they show the instantaneous radius vector. The popup label shows the terrestrial time, the radius vector (km) and the inertial speed (m/s).
Simulation date: 2023-04-11
The initial state of the satellite has been calculated using the following TLEs: .
Reentry date (averaged the TLEs of each set) @ % nominal confidence level (the actual confidence level is 1% to 2% higher):
upper bound of the solar indices
most probable solar indices
modulated lower bound of the solar indices
Best fit average ballistic coefficient: 270 kg/m2
NRLMSISE-00 data files: "SW-All.txt" updated 2023 Apr 11 12:40 UTC, "apr2023f10_prd.txt" updated 7 April 2023
High precision ITRF93 frame: created 2023-04-10T17:07:02 by NAIF/JPL
Gravity model: SGG-UGM-2 truncated to degree and order 15
The graph shows the predicted minimum, mean and maximum radius vector scaled to a reference sphere with radius of 6371 km (just to show an approximate altitude), but when the instantaneous radius vector drops below 125 km, the plots no longer show the mean radius vector (or semi-major axis), they show the instantaneous radius vector. The popup label shows the terrestrial time, the radius vector (km) and the inertial speed (m/s).
Here's the difference between the measured F10.7 index and the prediction used in the previous simulation (2022-09-14). The F10.7 index is used in the atmosphere model to calculate the air density.
The graph is useful to understand the nine-month difference in the reentry date.
The cumulative sum of the errors is very large (in absolute value), this means that the NASA's long range forecast, in this case, was poor.
Simulation date: 2022-09-14
The initial state of the satellite has been calculated using the following TLEs: .
Reentry date (averaged the TLEs of each set) @ % nominal confidence level (the actual confidence level is 1% to 2% higher):
upper bound of the solar indices
most probable solar indices
modulated lower bound of the solar indices
Best fit average ballistic coefficient: 274 kg/m2
NRLMSISE-00 data files: "SW-All.txt" updated 2022 Sep 14 18:41 UTC, "sep2022f10_prd.txt" updated 06 September 2022
High precision ITRF93 frame: created 2022-09-13T17:07:03 by NAIF/JPL
Gravity model: SGG-UGM-2 truncated to degree and order 15
The graph shows the predicted minimum, mean and maximum radius vector scaled to a reference sphere with radius of 6371 km (just to show an approximate altitude), but when the instantaneous radius vector drops below 125 km, the plots no longer show the mean radius vector (or semi-major axis), they show the instantaneous radius vector. The popup label shows the terrestrial time, the radius vector (km) and the inertial speed (m/s).
Simulation date: 2022-04-14
The initial state of the satellite has been calculated using the following TLEs: .
Reentry date: 2026-02-16 (averaged the 10 TLEs)
Best fit average ballistic coefficient: 259 kg/m2
NRLMSISE-00 data files: "SW-All.txt" updated 2022 Apr 14 12:40:00.00 UTC, "apr2022f10_prd.txt" updated 11 April 2022
Gravity model: SGG-UGM-2 truncated to degree and order 15
The graph shows the predicted minimum, mean and maximum radius vector scaled to a reference sphere with radius of 6371 km (just to show an approximate altitude), but when the instantaneous radius vector drops below 125 km, the blue plot no longer shows the mean radius vector (or semi-major axis), it shows the instantaneous radius vector. The popup label shows the terrestrial time, the radius vector (km) and the inertial speed (m/s).
Simulation date: 2021-05-14
The initial state of the satellite has been calculated using the following TLEs: .
Reentry date: 2025-09-19 (averaged the 10 TLEs), min: 2025-09-01, max: 2025-10-03
Best fit average ballistic coefficient: 274 kg/m2
NRLMSISE-00 data files: "SW-All.txt" updated 2021 May 14 18:45:14 UTC, "may2021f10_prd.txt" updated 13 May 2021
Gravity model: SGG-UGM-1 truncated to degree and order 15
The earlier reentry w.r.t. the previous simulation (about 4 months) is due to increased solar activity that began in October 2020.
The graph shows the predicted minimum, mean and maximum radius vector scaled to a reference sphere with radius of 6371 km (just to show an approximate altitude), but when the instantaneous radius vector drops below 125 km, the blue plot no longer shows the mean radius vector (or semi-major axis), it shows the instantaneous radius vector. The popup label shows the terrestrial time, the radius vector (km) and the inertial speed (m/s).
Simulation date: 2020-06-02
The initial state of the satellite has been calculated using the following TLEs: .
NRLMSISE-00 data files: "SW-All.txt" updated 2020 Jun 02 06:45:16 UTC, "may2020f10_prd.txt" updated 11 May 2020
Gravity model: SGG-UGM-1 truncated to degree and order 15
Reentry date: 2026-02-03 (averaged the 10 TLEs shown in the graph), min: 2026-01-20, max: 2026-02-21.
The graph shows the predicted minimum, mean and maximum radius vector scaled to a reference sphere with radius of 6371 km (just to show an approximate altitude), but when the instantaneous radius vector drops below 125 km, the blue plot no longer shows the mean radius vector (or semi-major axis), it shows the instantaneous radius vector. The popup label shows the terrestrial time, the radius vector (km) and the inertial speed (m/s).
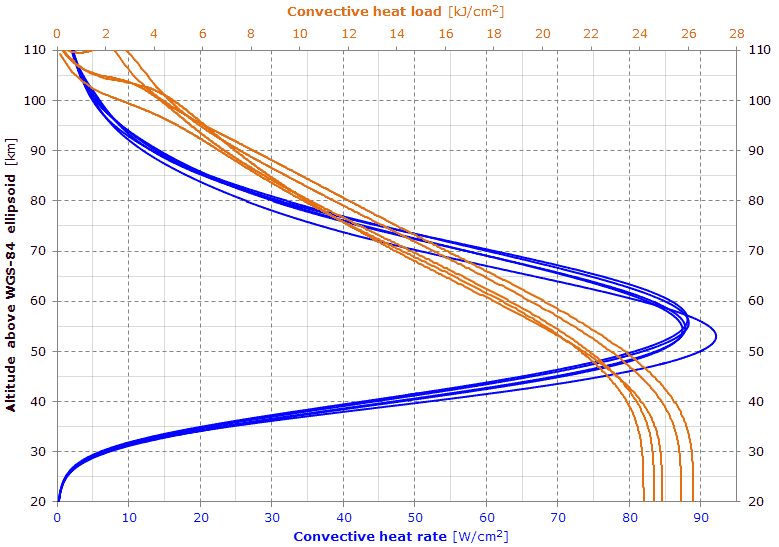
Here's the thermal stress prediction during reentry.
Given the high ballistic coefficient (this simulation yields an average ballistic coefficient of about 305/310 kg/m
2), the reentry speed will be high. Although the predicted heat rate is high, the heat load will be relatively small. This would suggest a very small ablation of the structure; in other words, most of the structure could reach the ground.
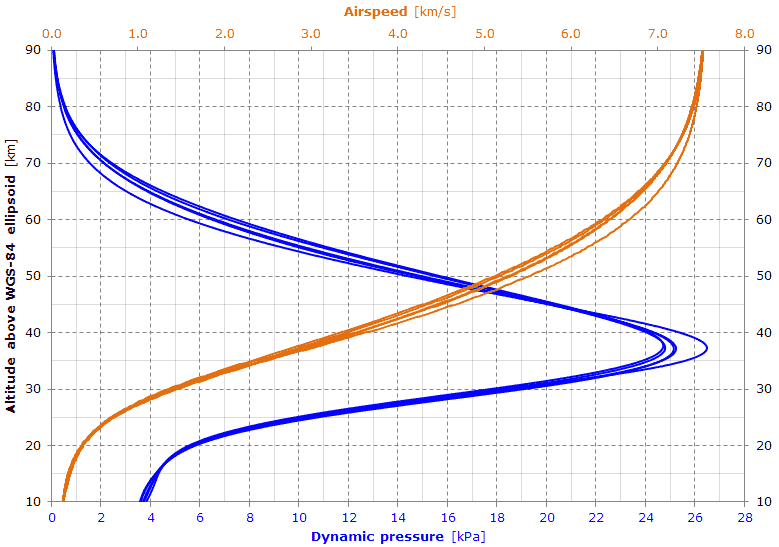
The graph shows the dynamic pressure and the airspeed during reentry.
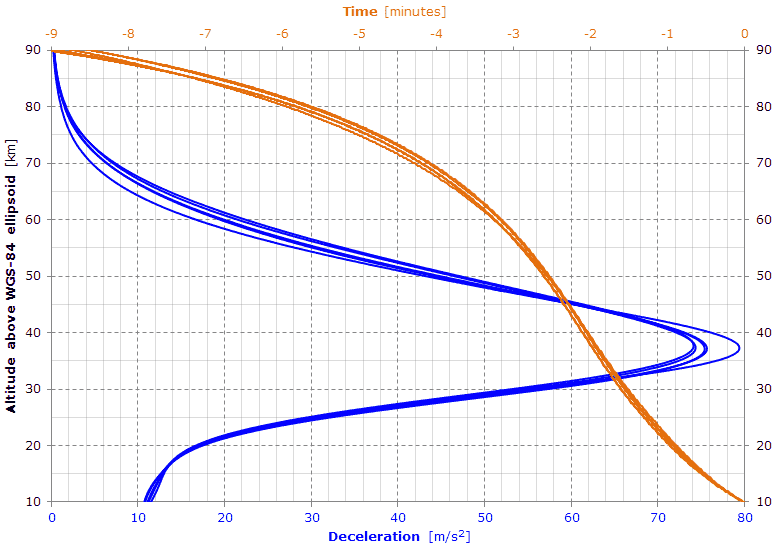
This last graph shows the deceleration and the time taken to go from 90 km down to 10 km.
Simulation date: 2019-03-19
Recently (March 2019), some websites have reported the news of the Cosmos 482 reentry. Some people claim that the reentry may even take place within this year (2019).
A simulation could be used to estimate a possible reentry date, but this date would vary continuously due to the unpredictability of the solar activity. However, if the simulation is done by setting the solar activity at very high values, it's possible to obtain a reliable lower bound for the reentry date.
Since the tracking quality for this satellite is very good (as shown by the TLEs analysis), the only significant unknown is the solar activity.
Please, see here for the calculations details (to speedup the simulation, the gravity model includes only the J2 and J3 perturbations) and here for the solar and geomagnetic indices.
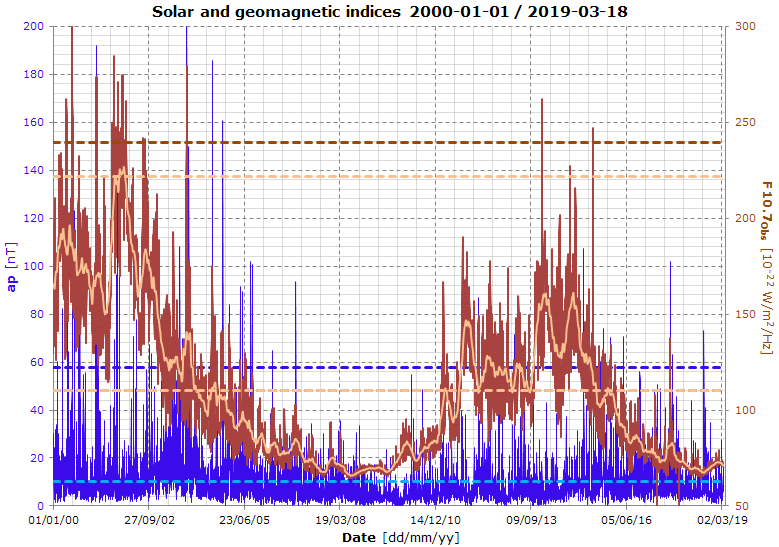
Here are the solar and geomagnetic indices used by the NRLMSISE-00 atmosphere model to calculate the air density.
The dashed lines represent the values used in this simulation. For each index, both the 99
th percentile and the average are shown (see next graphs for the exaplanation).
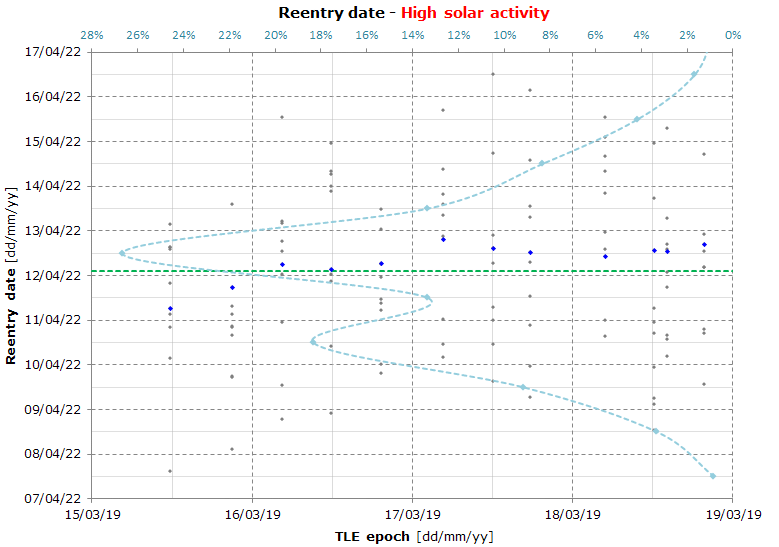
Here's the result of a Monte Carlo simulation used to calculate the reentry date for a
high solar activity.
The solar and geomagnetic indices have been set to very high level; the values used in this simulation are: ap = 58, daily F10.7 flux = 240 and 81-day average of F10.7 flux = 222.
Those values have been calculated as the 99
th percentile (rounded up to the nearest integer) of the values present in the "SpaceWeather-All-v1.2.txt" data file starting from 2000-01-01 (7017 values for each index).
The graph shows that the average reentry date is 2022-04-12. If we want to include also the (very small) TLE uncertainty for the lower bound of the reentry date, we obtain 2022-03-22 (99% confidence level).
All that said,
a reentry before March 2022 is very unlikely (by natural decay) or, more informally, a reentry before that date is completely impossible.
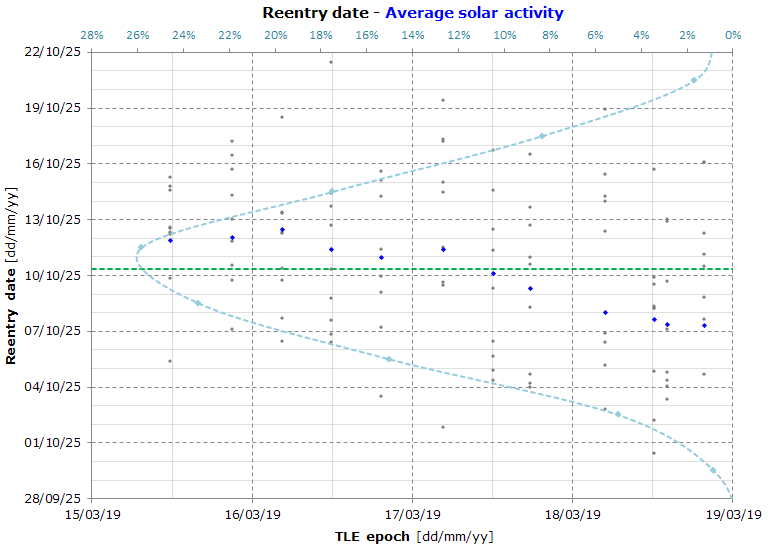
Here's the result of a Monte Carlo simulation used to calculate the reentry date for an
average solar activity.
The solar and geomagnetic indices have been set to the average of the values present in the "SpaceWeather-All-v1.2.txt" data file starting from 2000-01-01. The values used in this simulation are: ap = 10.33979977, daily F10.7 flux = 109.9133105 and 81-day average of F10.7 flux = 109.9285592.
The graph shows that the average reentry date is 2025-10-10.
If the F10.7 index will follow the same trend of the previous period before 2013/2014 peak, its value will be well below the average and, as a consequence, the reentry will take place not before 2026, but also the geomagnetic (ap) index will play a significant role.
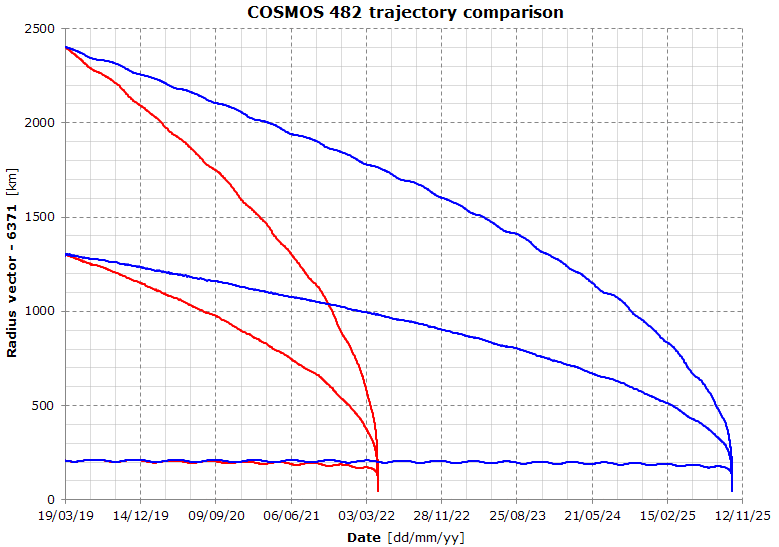
Here are the predicted semi-major axis, perigee and apogee obtained by propagating the newest TLE (19077.82138588).
The red plots are for the high solar activity, while the blue plots are for the average solar activity.
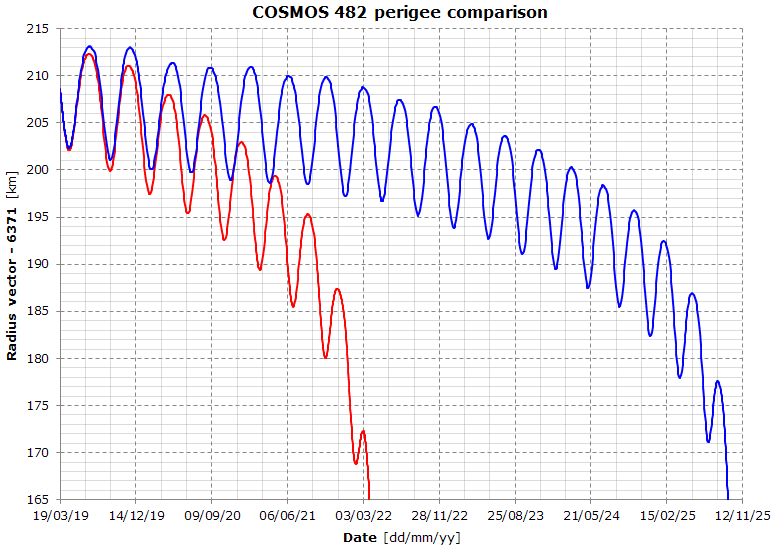
Here's the detailed view of the perigee.