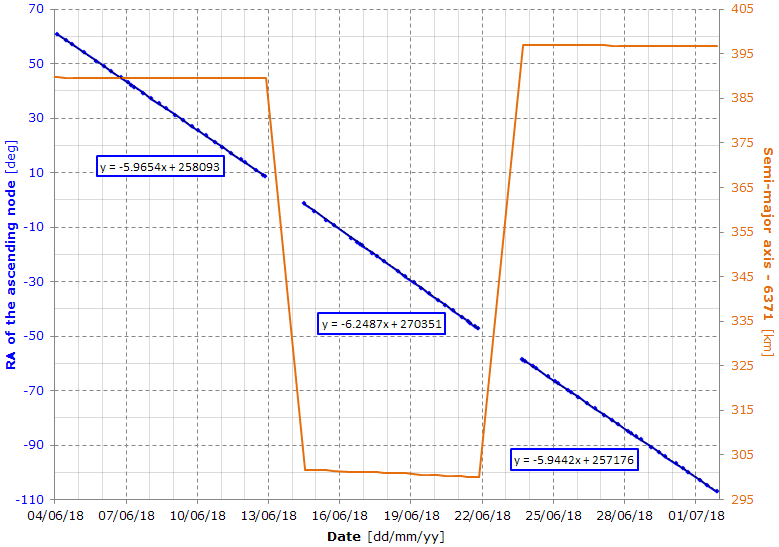
Here's the precession of the ascending node. The graph covers the "low altitude" phase. The orange plot shows the semi-major axis. The dots represent the available TLEs.
The three linear regressions show the precession rate in degree/day.
We see that during the low altitude phase, the nodal precession has slightly accelerated (as expected).
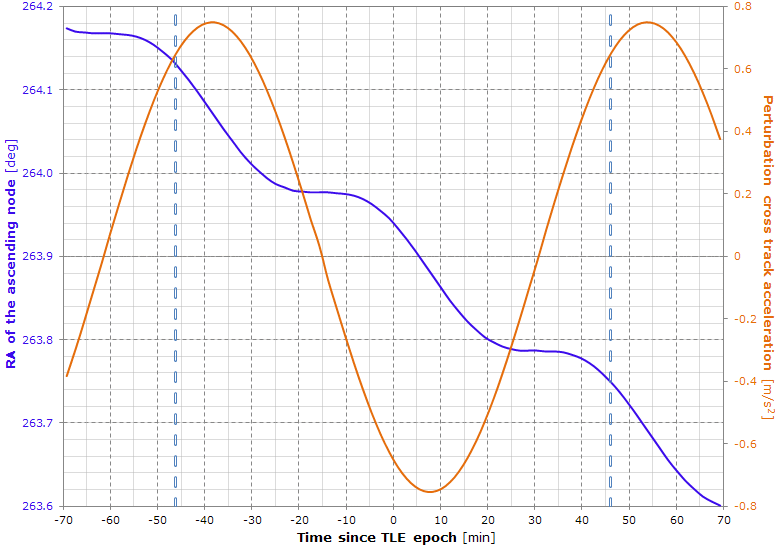
Also this graph shows the nodal precession, but here we see the short-periodic perturbations.
The two vertical dashed lines represent the orbital period.
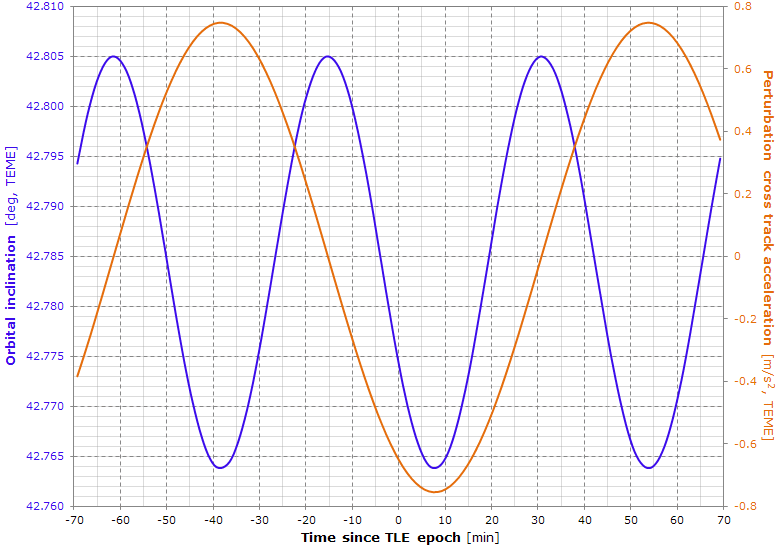
Like the previous graph, also this graph shows the short-periodic perturbations, but this graph is for the inclination.
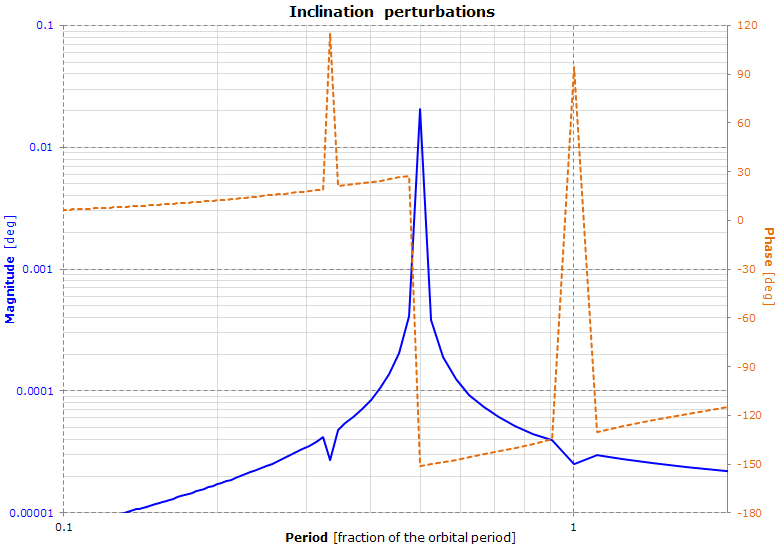 The largest perturbation is 0.0206 deg and its period is half the orbital period.
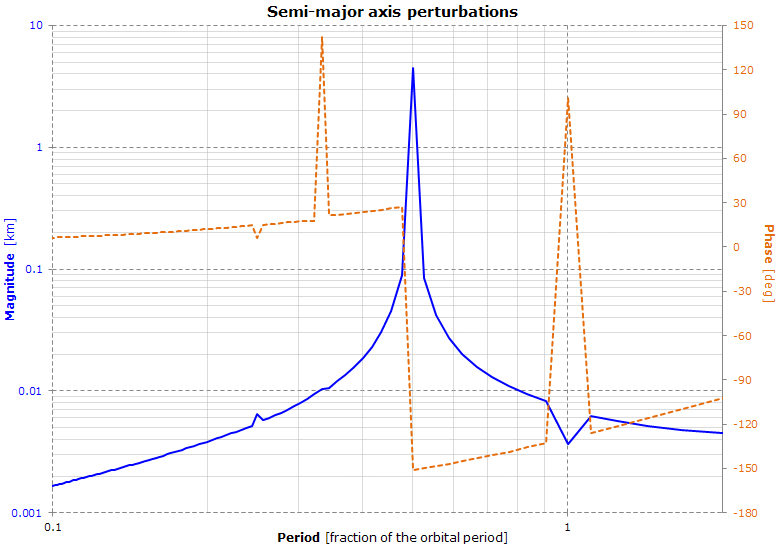 The largest perturbation for the semi-major axis is 4.5 km and its period is half the orbital period.