Tiangong-2 - Predicted trajectory
According to China Manned Space, Tiangong-2 will be deorbited on July 19 Beijing time (UTC = China Standard Time - 8 h).
Results of extensive analysis showed that if a Tiangong-2 TLE is propagated several days forward from the TLE epoch with the SGP4 propagator, the ground path almost exactly matches the one obtained from a newer TLE.
The following map has been obtained by propagating the TLE 19198.15481034 (July 17) with the SGP4 propagator. The map also shows the gray plot obtained from the TLE 19195.18967593 (July 14), but you need to zoom in to see the two plots.
Of all the possible orbits, only three seem the most likely for the reentry inside the target area and all pass over China:
- the earliest opportunity sets the start of the reentry window to July 18, 16:18 UTC (nearly midnight in Beijing);
- the second opportunity is for July 19, 13:41 UTC, the orbit is not as good as the others, but it passes over Beijing;
- the last opportunity is for July 19, 15:17 UTC.
If you hover the mouse over a point, a label appears showing the date (UTC), the latitude and the longitude of the points.
According to this site, Tiangong-2 will be deorbited after July 2019.
With a simulation we can predict the approximate Tiangong-2 altitude at the epoch of the deorbit burn.
The simulation includes the Newtonian and the relativistic accelerations of all the planets, Sun and Moon. The Earth's gravity field is modeled with the SGG-UGM-1 gravity model (computed using EGM2008 derived gravity anomaly and GOCE observation data) truncated to the degree and order 15. For the calculation of the air density, I use the NRLMSISE-00 model along with an updated data file for the solar and geomagnetic indices.
The simulation assumes a constant Tiangong-2 attitude, but the drag coefficient slightly varies with the atmosphere composition and therefore with the altitude.
Simulation date: 2019-01-25
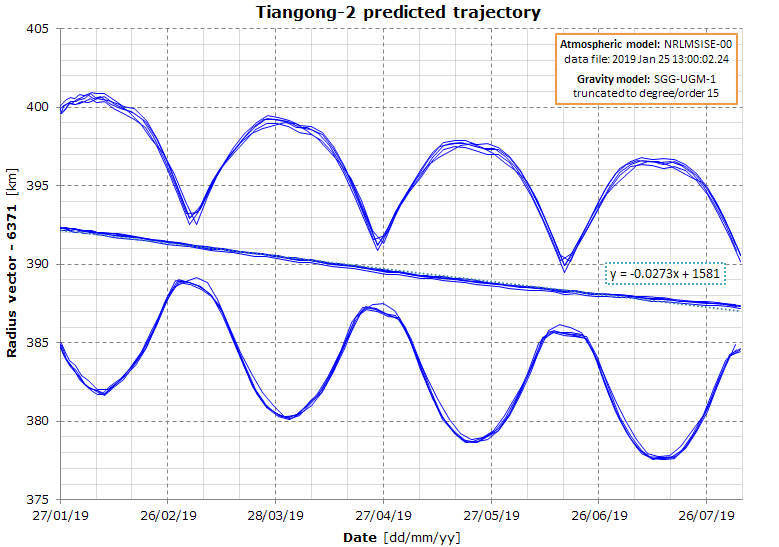
The graph shows the predicted average, minimum and maximum radius vector and the average decay rate.
The trajectories have been obtained by propagating the newest 4 TLEs with my high accuracy propagator.
Since the best fit average ballistic coefficient slightly increased in this simulation (now it is about 139.3 kg/m
2), the average decay rate has decreased accordingly and now it is about 27 m/day.
Simulation date: 2018-12-15
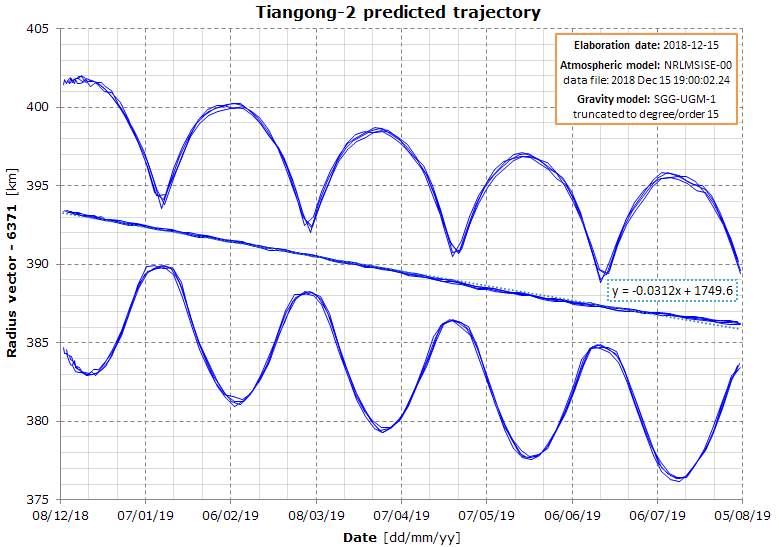
The graph shows the predicted average, minimum and maximum radius vector and the average decay rate (it will be about 31 m/day).
The best fit average ballistic coefficient is about 123 kg/m
2 for this update.
The trajectories have been obtained by propagating 4 TLEs with my high accuracy propagator.
Simulation date: 2018-10-24
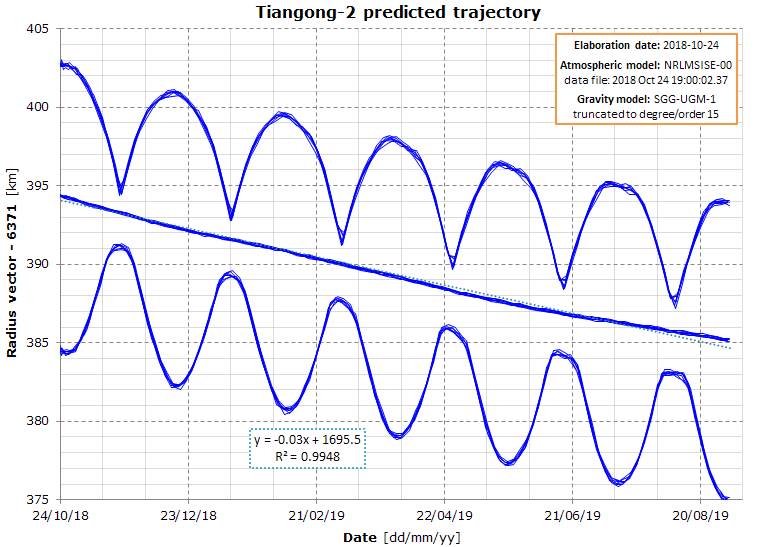
The graph comes from an improved simulation and it shows the predicted average, minimum and maximum radius vector and the average decay rate, which will be about 30 m/day. The average ballistic coefficient is about 129.5 kg/m
2.
The trajectories have been obtained from 8 TLEs from 18290 to 18297 by calculating the initial satellite state for the TLE epoch with the SGP4 propagator, then that initial state is propagated with my high accuracy propagator.
Simulation date: 2018-09-27

The graph shows the predicted average, minimum and maximum radius vector and the average decay rate (it will be about 31.6 m/day).
At the epoch of the deorbit burn, the station altitude should be in the range 380 to 385 km.
The plotted data have been obtained from the 8 most recent TLEs by calculating the initial state (position and velocity) of the satellite with the SGP4 propagator, then that initial state is propagated with my high accuracy propagator.