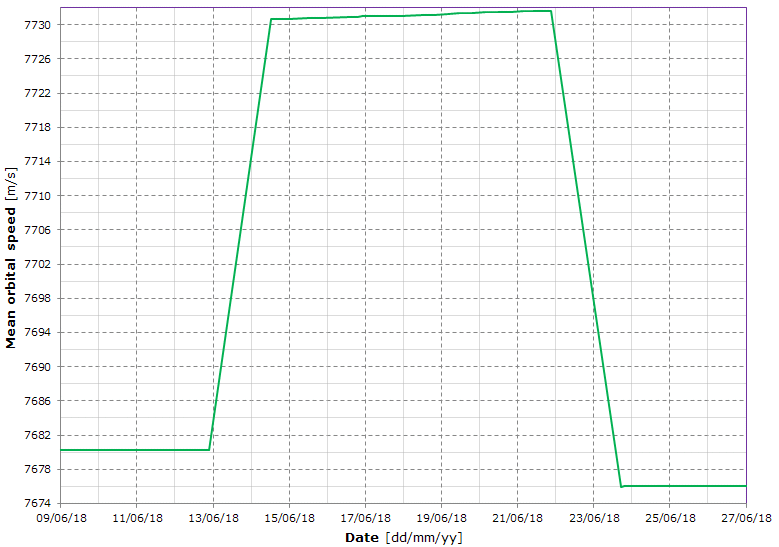
The graph shows the mean orbital speed shortly before and after the low altitude phase.
The \(\Delta V\) used to deboost and to reboost the station can be easily calculated as the difference between the mean speed before the manoeuvre and the mean speed after the same manoeuvre.
Values for the deboost: \(\Delta R = 87.8\ km\) and \(\Delta V = 50.4\ m/s\); values for the reboost: \(\Delta R = 97\ km\) and \(\Delta V = 55.7\ m/s\).
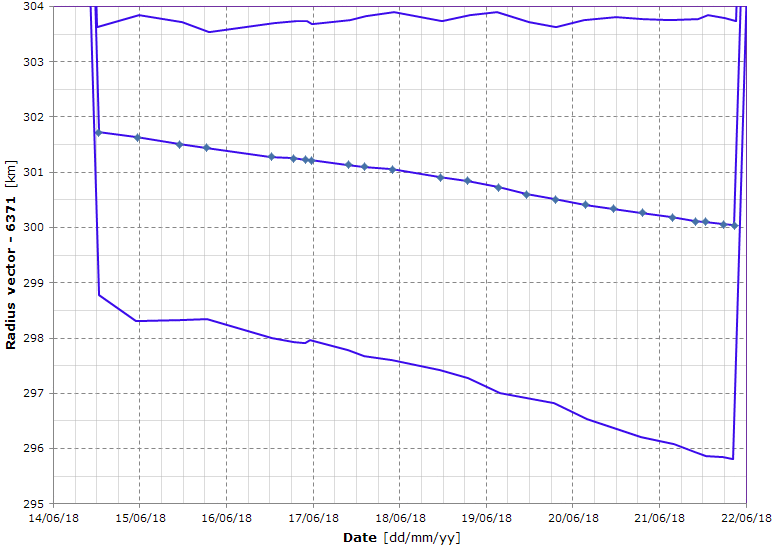
The graph shows the average, minimum, and maximum radius vector during the low altitude phase (the dots along the mean radius vector plot are the TLEs).
The apogee radius vector between the deboost and the reboost is almost constant, while it should vary continuously because of the Earth's flattening (mainly the J
2 perturbation), as clearly shown
here (select "Tiangong 2"). That means that some additional force has been applied when the station was near the perigee. Since the apogee radius vector was expected to increase (because of the J
2 perturbation), the additional force was retrograde. There are only two possible ways to do that: engines (probably the vernier thruster or RCS engines should suffice), differential drag (low drag attitude at the apogee and high drag attitude at the perigee).
The result obtained from a simulation showed that the differential drag method is sufficient to reproduce the orbits obtained from the TLEs.
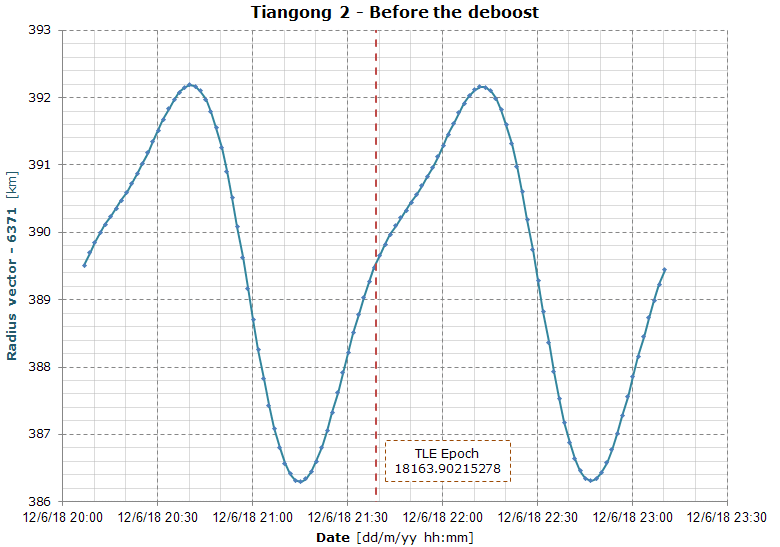
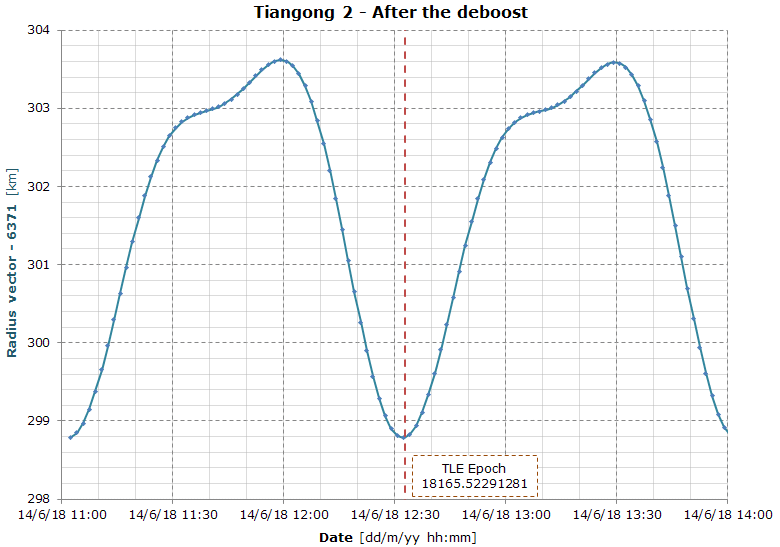
These two graphs show the instantaneous radius vector before and after the deboost. The dots are the calculated points with step size = 60 s.
The orbit changed from 386.3 x 392.2 km before the deboost to 298.8 x 303.6 km after the deboost.