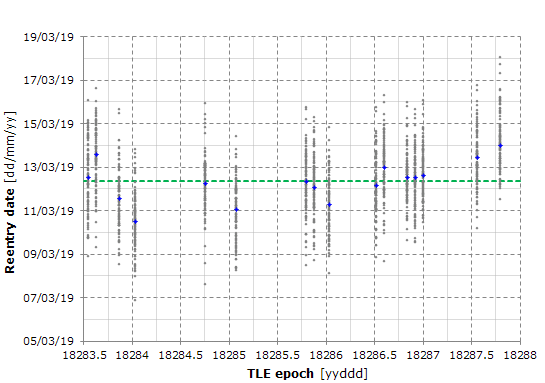
 The horizontal axis shows the epoch of the TLEs used for the calculation of the satellite initial state and the vertical axis shows the reentry dates obtained by propagating the initial state.
The dashed green line represents the average of all the dates (gray and blue dots).
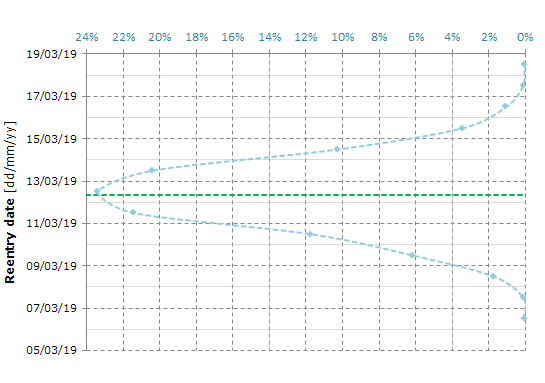 This additional plot helps in finding how many dates lie in a given interval.