Air data
This page is periodically updated with some graphs related to the air density.
The air density is calculated by means of the NRLMSISE-00 atmosphere model along with the file "SW-All.csv" for the updated solar and geomagnetic indices. The data file can be downloaded from
CelesTrak.
Data file:
The following graph shows the indices used by the NRLMSISE-00 atmosphere model to calculate the air density.
The dashed vertical line represents the start date of the predicted values.
The following graph shows the air density for three geodetic altitudes: 250, 350 and 450 km, over a point with latitude = 0 and longitude = 0.
The scale of the vertical axis (air density) is logarithmic.
The air density is calculated by means of the NRLMSISE-00 atmosphere model along with the file "SpaceWeather-All-v1.2.txt" for the updated solar and geomagnetic indices. The data file can be downloaded
here (about 3 MiB).
Data file: 2018-12-27
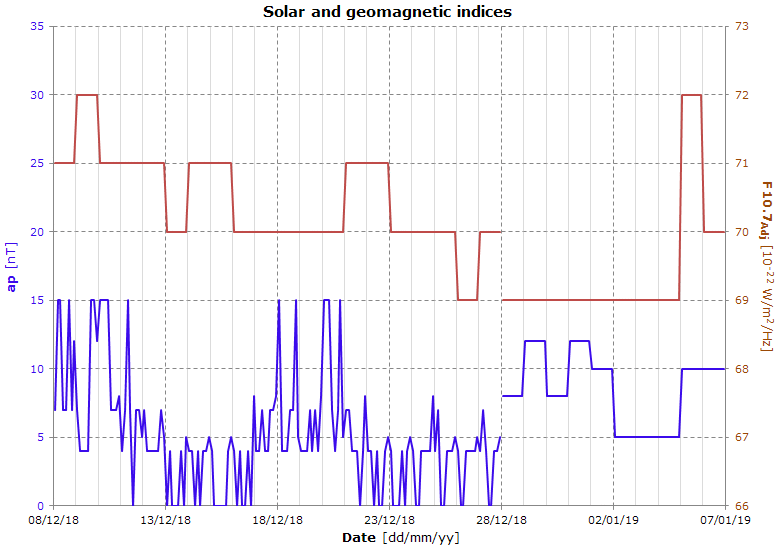
The graph shows the indices used by the NRLMSISE-00 atmosphere model to calculate the air density.
.png)
The graph shows the air density for three geodetic altitudes: 250, 350 and 450 km.
The dashed vertical line represents the start date of the predicted density.
The scale of the vertical axis (air density) is logarithmic, but instead of the usual base 10, the base used here is 2 (each gridline represents a density that it is twice the value of the preceding gridline).
Data file: 2018-11-11
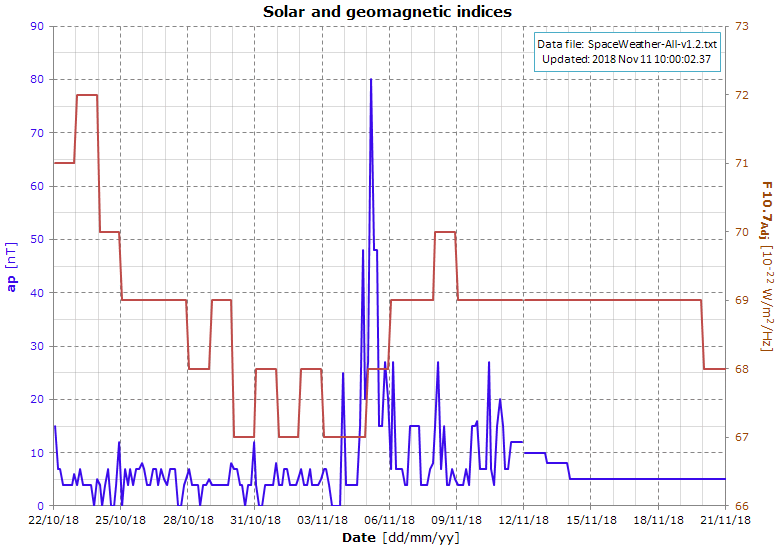
The graph shows the indices used by the NRLMSISE-00 atmosphere model to calculate the air density.
After Nov 11 the graph shows the predicted values.
.png)
The graph shows the air density for three geodetic altitudes: 250, 350 and 450 km.
The dashed vertical line represents the start date of the predicted density.
The scale of the vertical axis (air density) is logarithmic, but instead of the usual base 10, the base used here is 2 (each gridline represents a density that it is twice the value of the preceding gridline).
Data file: 2018-09-13
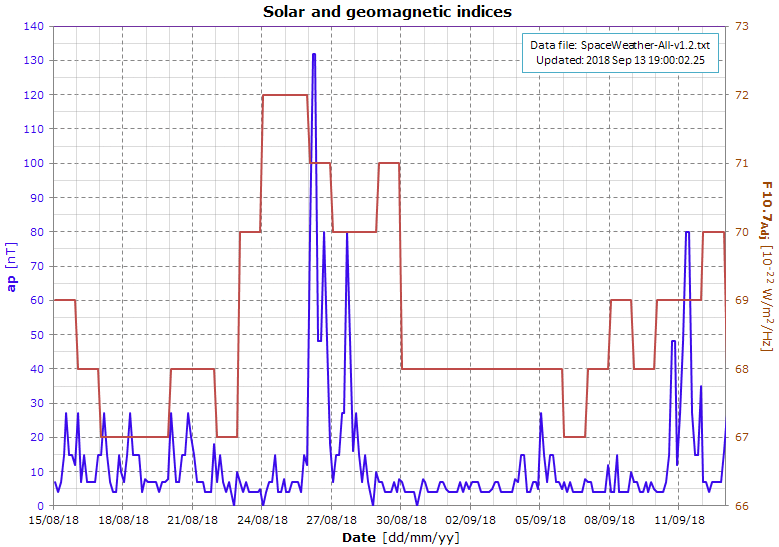
The graph shows the indices used by the NRLMSISE-00 atmosphere model to calculate the air density.
While the F10.7 index doesn't show any particular variation, the ap index (planetary equivalent amplitude) shows a big peak on Aug 26, followed by several smaller (but unusual) peaks. As a consequence, the air density increased and the decay rate of the satellites with an altitude below about 450 km increased accordingly.
.png)
The effect of the peaks on the air density is shown in this graph; the 3 plots are for the 3 geodetic altitudes: 250, 350 and 450 km.
The scale of the vertical axis (air density) is logarithmic, but instead of the usual base 10, the base used here is 2 (each gridline represents a density that it is twice the value of the preceding gridline).